
For years, data scientists and engineers faced a common bottleneck when showcasing their work: the deployment gap. You could write brilliant Python scripts, build complex machine learning models, or wrangle massive datasets, but sharing those insights with non-technical stakeholders usually meant building a full-stack web application with React, HTML, CSS, and an external API backend like Flask or FastAPI.
Streamlit changes this paradigm completely.
It is an open-source Python framework that allows you to turn data scripts into interactive, beautiful web apps in minutes—with zero front-end web development experience required. If you can write plain Python, you can build a production-ready web application.
In this guide, we’ll explore the unique architecture that makes Streamlit work and build a complete data app step by step.
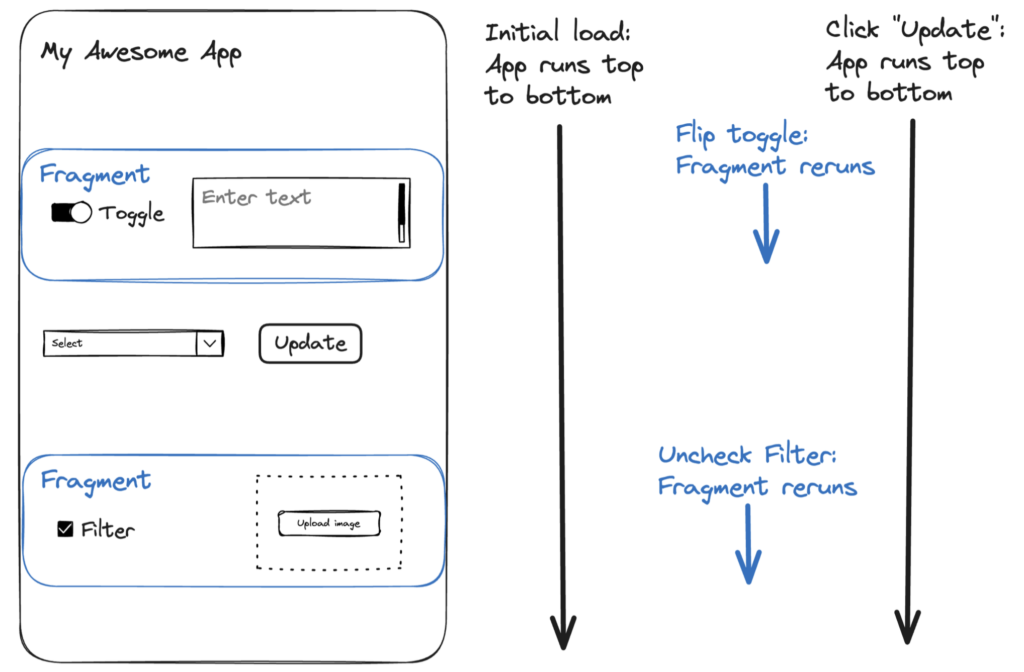
🏗️ The Streamlit Architecture: The “Rerun” Paradigm
Traditional web frameworks rely on complex event listeners, callbacks, and state managers to update the user interface when a button is clicked or a slider is moved. Streamlit throws that out the window in favor of a clean, reactive model.
streamlit architecture data flow script rerun paradigm. Source: docs.streamlit.io
How it works under the hood:
- Top-to-Bottom Execution: Streamlit applications are just pure Python files executed from top to bottom.
- The Reactive Trigger: The exact moment a user interacts with a UI element (like dragging a slider, checking a box, or selecting a dropdown item), Streamlit reruns your entire Python script from the very first line.
- State Management: As the script reruns, Streamlit secretly caches the updated value of the widget that triggered the rerun. If a user sets a slider to
50, that slider variable reads as50on the next execution loop.
While executing a whole script sequentially sounds inefficient, Streamlit combines this with an incredibly powerful caching mechanism (@st.cache_data) that prevents heavy operations—like querying database servers or loading machine learning models—from re-running unnecessarily.
🛠️ Step-by-Step Implementation Guide
Let’s build a functional Data Dashboard that lets users dynamically generate data, filter values using an interactive sidebar, visualize metrics using charts, and cache heavy computation tasks.
Step 1: Install Streamlit
Open your terminal and install the framework via pip:
Bash
pip install streamlit pandas numpy
Step 2: Create Your App Structure & Caching
Create a new file named app.py. We will start by defining our app layout and adding a cached data loading function to simulate a heavy database call.
Python
import streamlit as st
import pandas as pd
import numpy as np
import time

# 1. App Configurations & Headings
st.set_page_config(page_title="Data Dashboard", page_icon="📊", layout="wide")
st.title("📊 Interactive Data Analysis Dashboard")
st.write("Welcome to your first functional Streamlit application.")

# 2. Caching heavy data load operations
@st.cache_data
def load_large_dataset():
    # Simulate a slow 3-second network/database query
    time.sleep(3)

    # Generate mock time-series data
    chart_data = pd.DataFrame(
        np.random.randn(50, 3),
        columns=['Metric A', 'Metric B', 'Metric C']
    )
    return chart_data

# Call the function (displays a loading spinner on the first run only)
with st.spinner("Fetching secure data from database..."):
    df = load_large_dataset()
Step 3: Add Interactive Sidebar Inputs
Now, let’s leverage Streamlit’s structural layout tools to build an interactive control room inside the sidebar panel.
Python
# 3. Sidebar Layout Controls
st.sidebar.header("🛠️ Dashboard Settings")

# Add a text input box
user_name = st.sidebar.text_input("Enter your name:", "Guest User")

# Add a slider to control chart data view limits
row_limit = st.sidebar.slider(
    label="Select number of data rows to display:",
    min_value=5,
    max_value=50,
    value=20  # Default starting value
)

# Add a dropdown menu to select specific metrics
selected_metric = st.sidebar.selectbox(
    "Choose primary metric focus:",
    options=['Metric A', 'Metric B', 'Metric C']
)
Step 4: Build Dynamic UI Layouts & Charts
We can display content cleanly by splitting the main viewport into vertical columns and rendering data visualizations dynamically based on the sidebar settings.
Python
# 4. Main Panel Layout
st.markdown(f"### Hello, **{user_name}**! Here is your custom report:")

# Create two columns side-by-side
col1, col2 = st.columns(2)

with col1:
    st.subheader("📋 Raw Data Preview")
    # Slice the dataframe dynamically based on the sidebar slider input
    filtered_df = df.head(row_limit)
    st.dataframe(filtered_df)

with col2:
    st.subheader(f"📈 Focus View: {selected_metric}")
    # Render an interactive native line chart of the selected column
    st.line_chart(filtered_df[selected_metric])
Step 5: Incorporate Action Buttons & State Flags
Let’s add an interactive button component that changes the app state when clicked:
Python
# 5. Interactive Action Buttons
st.markdown("---")
if st.button("🎉 Finalize Report"):
    st.balloons()
    st.success("Report successfully generated and locked in local browser session storage!")
🚀 How to Run Your Web Application
Do not run your script using the standard python app.py command. Streamlit requires its own server engine wrapper to listen for changes. Run this command in your terminal:
Bash
streamlit run app.py
Streamlit will immediately fire up a local development server and automatically open a tab in your default web browser at http://localhost:8501.
Try modifying the sidebar slider or picking a different metric dropdown option—you will instantly watch the chart and tables redraw in real-time.
📈 Top 3 Streamlit Best Practices for Production
As your Streamlit projects grow from prototypes to production dashboards, keep these optimization guidelines in mind:
- Understand the Cache Split: Use
@st.cache_datafor storing data frames, CSV files, SQL query outputs, or raw text strings. Use@st.cache_resourcefor persisting heavy structural objects that can’t be easily serialized, like database connection pools, OpenAI client instances, or PyTorch neural network weights. - Keep the UI Snappy: Because the script reruns entirely on every click, avoid placing heavy loops or file I/O operations directly in the main layout without caching them. If a step takes time, wrap it in a
with st.spinner():block. - Utilize Session State: If you want values to survive across subsequent script reruns (like tracking multiple pages, user multi-step login flows, or preserving intermediate calculation steps), use Streamlit’s global dictionary object:
st.session_state.